AI·빅데이터 융합 경영학 Study Note
[ML수업] 6주차 실습: Evaluation Metrics: Measuring Model Performance 본문
카테고리 없음
[ML수업] 6주차 실습: Evaluation Metrics: Measuring Model Performance
SubjectOwner 2023. 11. 21. 15:50import matplotlib.pyplot as plt
%matplotlib inline
import numpy as np
#불균형 데이터 생성
from sklearn.datasets import load_digits
digits = load_digits()
y = digits.target == 9 # 숫자 9를 posive class로 설정하여 불균형 데이터 생성
(y == True).mean() # y가 ture(숫자 9)인 비율
#0.1001669449081803
from sklearn.model_selection import train_test_split
X_train, X_test, y_train, y_test = train_test_split(digits.data, y, random_state=0)y = digits.target == 9: 이 부분은 데이터셋에서 숫자 9를 양성 클래스로 설정하여 클래스 불균형을 만듭니다. digits.target은 데이터셋의 숫자 레이블을 나타내며, digits.target == 9는 숫자 9가 있는 위치를 True로, 그 외의 숫자는 False로 표시한 불리언(Boolean) 배열을 생성합니다. 이렇게 생성된 y는 불균형한 클래스 분포를 가진 레이블로, 숫자 9가 있는 샘플은 양성 클래스로, 그 외의 숫자는 음성 클래스로 간주됩니다.
(y == True).mean(): 이 부분은 불균형한 데이터셋에서 양성 클래스의 비율을 계산합니다. (y == True)는 양성 클래스인 경우에 True, 음성 클래스인 경우에 False로 이루어진 불리언 배열을 생성하며, .mean()은 True 값의 비율을 계산합니다
### Imbalanced Data
Training Models
***Dummy***
# Class label 중에 무조건 다수인 것으로 예측
# 가장 빈번한 클래스로 예측하는 더미(dummy) 분류기 생성
from sklearn.dummy import DummyClassifier

## 더미 분류기를 사용하여 테스트 데이터에 대한 예측 수행
dummy = DummyClassifier(strategy='most_frequent').fit(X_train, y_train)
pred_dummy = dummy.predict(X_test)
***Decision Tree***
from sklearn.tree import DecisionTreeClassifier

tree = DecisionTreeClassifier(max_depth=3).fit(X_train, y_train)
pred_tree = tree.predict(X_test)***Logistic Regrssion***
from sklearn.linear_model import LogisticRegression

logit = LogisticRegression(C=0.0001).fit(X_train, y_train)
pred_logit = logit.predict(X_test)
C 매개변수는 정규화 강도를 조절하는데 사용됩니다
C 값은 양수이며, 작은 값일수록 강한 정규화를 나타냅니다. ( 과적합을 줄이는데 도움이 되며, 훈련 데이터에 대한 정확성을 향상시키는 대신 일반화 성능을 향상시킵니다.)
### Accuracy ###
from sklearn.metrics import accuracy_score

print("dummy:", accuracy_score(y_test, pred_dummy))
print("tree:", accuracy_score(y_test, pred_tree))
print("logit:", accuracy_score(y_test, pred_logit))

'''
dummy: 0.8955555555555555
tree: 0.9311111111111111
logit: 0.9133333333333333
'''
### Confusion Matrix ###

아래는 분류 모델의 혼동 행렬(Confusion Matrix)을 시각화하는 Python 코드 예제입니다:
from sklearn.metrics import confusion_matrix, ConfusionMatrixDisplay

# 3개의 서브차트로 도식
fig, ax = plt.subplots(1, 3, figsize=(15,3))

# 첫번째 서브차트: dummy
ConfusionMatrixDisplay.from_estimator(dummy, X_test, y_test, display_labels=["not 9", "9"], ax=ax[0])
# 두번째 서브차트: tree
ConfusionMatrixDisplay.from_estimator(tree, X_test, y_test, display_labels=["not 9", "9"], ax=ax[1])
# 세번째 서브차트: logit
ConfusionMatrixDisplay.from_estimator(logit, X_test, y_test, display_labels=["not 9", "9"], ax=ax[2])

ax[0].set_title('dummy')
ax[1].set_title('tree')
ax[2].set_title('logit')
plt.show()

### Recall, Precision & F1 ###
from sklearn.metrics import classification_report

print("dummy:")
print(classification_report(y_test, pred_dummy, target_names=["not 9", "9"], zero_division=0))
print("\ntree:")
print(classification_report(y_test, pred_tree, target_names=["not 9", "9"], zero_division=0))
print("\nlogit:")
print(classification_report(y_test, pred_logit, target_names=["not 9", "9"], zero_division=0))

'''
dummy:
              precision    recall  f1-score   support

       not 9       0.90      1.00      0.94       403
           9       0.00      0.00      0.00        47

    accuracy                           0.90       450
   macro avg       0.45      0.50      0.47       450
weighted avg       0.80      0.90      0.85       450


tree:
              precision    recall  f1-score   support

       not 9       0.95      0.97      0.96       403
           9       0.70      0.60      0.64        47

    accuracy                           0.93       450
   macro avg       0.83      0.78      0.80       450
weighted avg       0.93      0.93      0.93       450


logit:
              precision    recall  f1-score   support
...
    accuracy                           0.91       450
   macro avg       0.96      0.59      0.62       450
weighted avg       0.92      0.91      0.88       450
'''
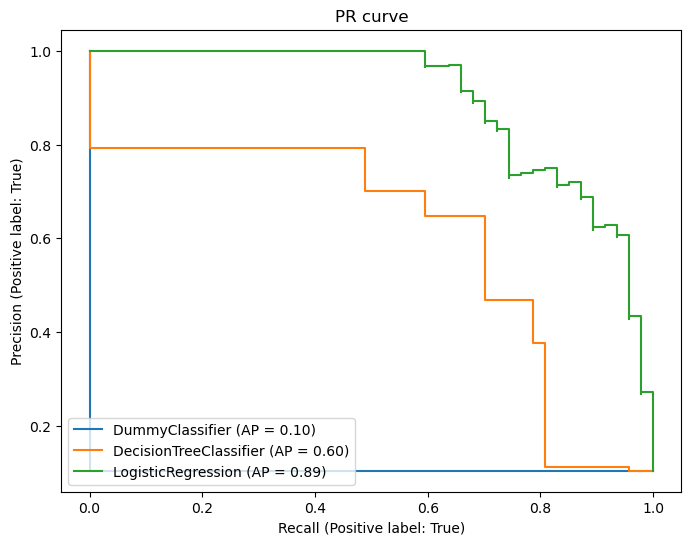
##### PR curve
아래는 분류 모델의 평균 정밀도(Average Precision)를 계산하고 출력하는 Python 코드 예제입니다:
from sklearn.metrics import average_precision_score

# AP(Average Precision)
print('dummy: ', average_precision_score(y_test, dummy.predict_proba(X_test)[:,1]))
print('tree: ', average_precision_score(y_test, tree.predict_proba(X_test)[:,1]))
print('logit: ', average_precision_score(y_test, logit.predict_proba(X_test)[:,1]))

'''
dummy:  0.10444444444444445
tree:  0.6003999947173272
logit:  0.8946824790573934
'''
PR 커브 시각화
from sklearn.metrics import PrecisionRecallDisplay

fig, ax = plt.subplots(1, 1, figsize=(8,6))

PrecisionRecallDisplay.from_estimator(dummy, X_test, y_test, ax=ax)
PrecisionRecallDisplay.from_estimator(tree, X_test, y_test, ax=ax)
PrecisionRecallDisplay.from_estimator(logit, X_test, y_test, ax=ax)

ax.set_title('PR curve')
plt.show()
##### PR by threshold
def plot_precision_recall_by_threshold(precisions, recalls, thresholds) :
    # X축을 threshold값으로, Y축은 정밀도, 재현율 값으로 각각 Plot 수행. 정밀도는 점선으로 표시
    # plt.figure(figsize=(8,6))
    threshold_boundary = thresholds.shape[0]
    plt.plot(thresholds, precisions[0:threshold_boundary], linestyle='--', label='precision')
    plt.plot(thresholds, recalls[0:threshold_boundary],label='recall')
    # threshold 값 X 축의 Scale을 0.1 단위로 변경
    _, end = plt.xlim()
    plt.xticks(np.round(np.arange(0, end, 0.1),2))
    # x축, y축 label과 legend, grid, title 설정
    plt.xlabel('Threshold'); #plt.ylabel('Precision & Recall')
    plt.legend(); plt.grid(); plt.title('PR by threshold')
    plt.show()

from sklearn.metrics import precision_recall_curve

precisions, recalls, thresholds = precision_recall_curve(y_test, logit.predict_proba(X_test)[:,1])
plot_precision_recall_by_threshold(precisions, recalls, thresholds)
### ROC-AUC

##### AUC
아래는 scikit-learn 라이브러리를 사용하여 분류 모델의 ROC 곡선 아래 면적(AUC, Area Under the Curve)을 계산하고 출력하는 Python 코드 예제입니다: 높은 AUC 값은 모델의 성능이 더 좋다는 것을 나타냅니다.
from sklearn.metrics import roc_curve
from sklearn.metrics import auc

fpr, tpr, _ = roc_curve(y_test, dummy.predict_proba(X_test)[:,1])
print('dummy: ', auc(fpr, tpr))

fpr, tpr, _ = roc_curve(y_test, tree.predict_proba(X_test)[:,1])
print('tree: ', auc(fpr, tpr))

fpr, tpr, _ = roc_curve(y_test, logit.predict_proba(X_test)[:,1])
print('logit: ', auc(fpr, tpr))

'''
dummy:  0.5
tree:  0.862995617971596
logit:  0.9792513594847156
'''
##### ROC curve ####
from sklearn.metrics import RocCurveDisplay

fig, ax = plt.subplots(1, 1, figsize=(8,6))

RocCurveDisplay.from_estimator(dummy, X_test, y_test, ax=ax)
RocCurveDisplay.from_estimator(tree, X_test, y_test, ax=ax)
RocCurveDisplay.from_estimator(logit, X_test, y_test, ax=ax)

ax.set_title('ROC curve')
plt.show()
